
Plan and reality for every shift. OEE calculates itself.
As long as tally marks from the floor get retyped into Excel each evening, management hears about a drop a month later and argues over whether the number even holds. Production Management captures the plan, output, scrap and downtime where they happen, so OEE, shift handover and management dashboards all build themselves - from the same data.
TPM licence · shifts, production reporting, issue reporting and live data in one · MES (production orders, batches and part traceability) is coming as a follow-up module on our roadmap
OEE from Excel that nobody trusts
"The spreadsheet, tomorrow at best"
Operators write tally marks on paper, the supervisor retypes them into Excel in the evening, and OEE is estimated from guesses. When the number is off, nobody knows whether pieces, scrap or downtime are missing.
"The morning shift has no idea what the night left"
The floor is handed over verbally, in the doorway. Open problems, half-done maintenance and the reasons for night-time downtime vanish before the incoming supervisor pours their coffee.
"The line is down and only the floor knows"
A breakdown is reported by phone, to whoever picks up. Maintenance arrives late, the downtime length is never written down, and the analytics never learn about the stoppage.
Production Management collects the plan, output, scrap and downtime in one place: output says how much was made, reports say why and for how long it stood, and OEE and every live view are built from both.
Not new screens. A different way of working.
The supervisor stops retyping tally marks each evening
Data is created during the shift. Admin moves from the end of the day to the moment you are standing at the machine anyway.
Downtime has a duration, a reason and a name
Every stoppage is logged with a type and duration. Discussions about causes rest on records, not memories.
Management sees today, not last month
The Shift overview and LCD panels on the floor show status continuously, so the response comes during the shift.
Improvement has something to build on
Reports and output data form the basis for analytics, recurring problems and action plans.
Numbers make no excuses
In six months we achieved more than a 15% rise in overall production efficiency. Because delayed orders are no longer being chased, the team is calmer and in better spirits.
Figures are based on iDomino case studies and internal data from manufacturing projects, 2020 to 2026.
From plan to handover without a single sheet of paper
The supervisor plans the shift in the calendar: shift type, the shift team, the lead, station staffing and a production plan by product. The system checks for time clashes with another shift on the same workplace.
The operator opens the shift and logs output by the hour: for each product they enter OK pieces; NOK is derived from scrap records. Entries save automatically and usually only the current hour can be edited.
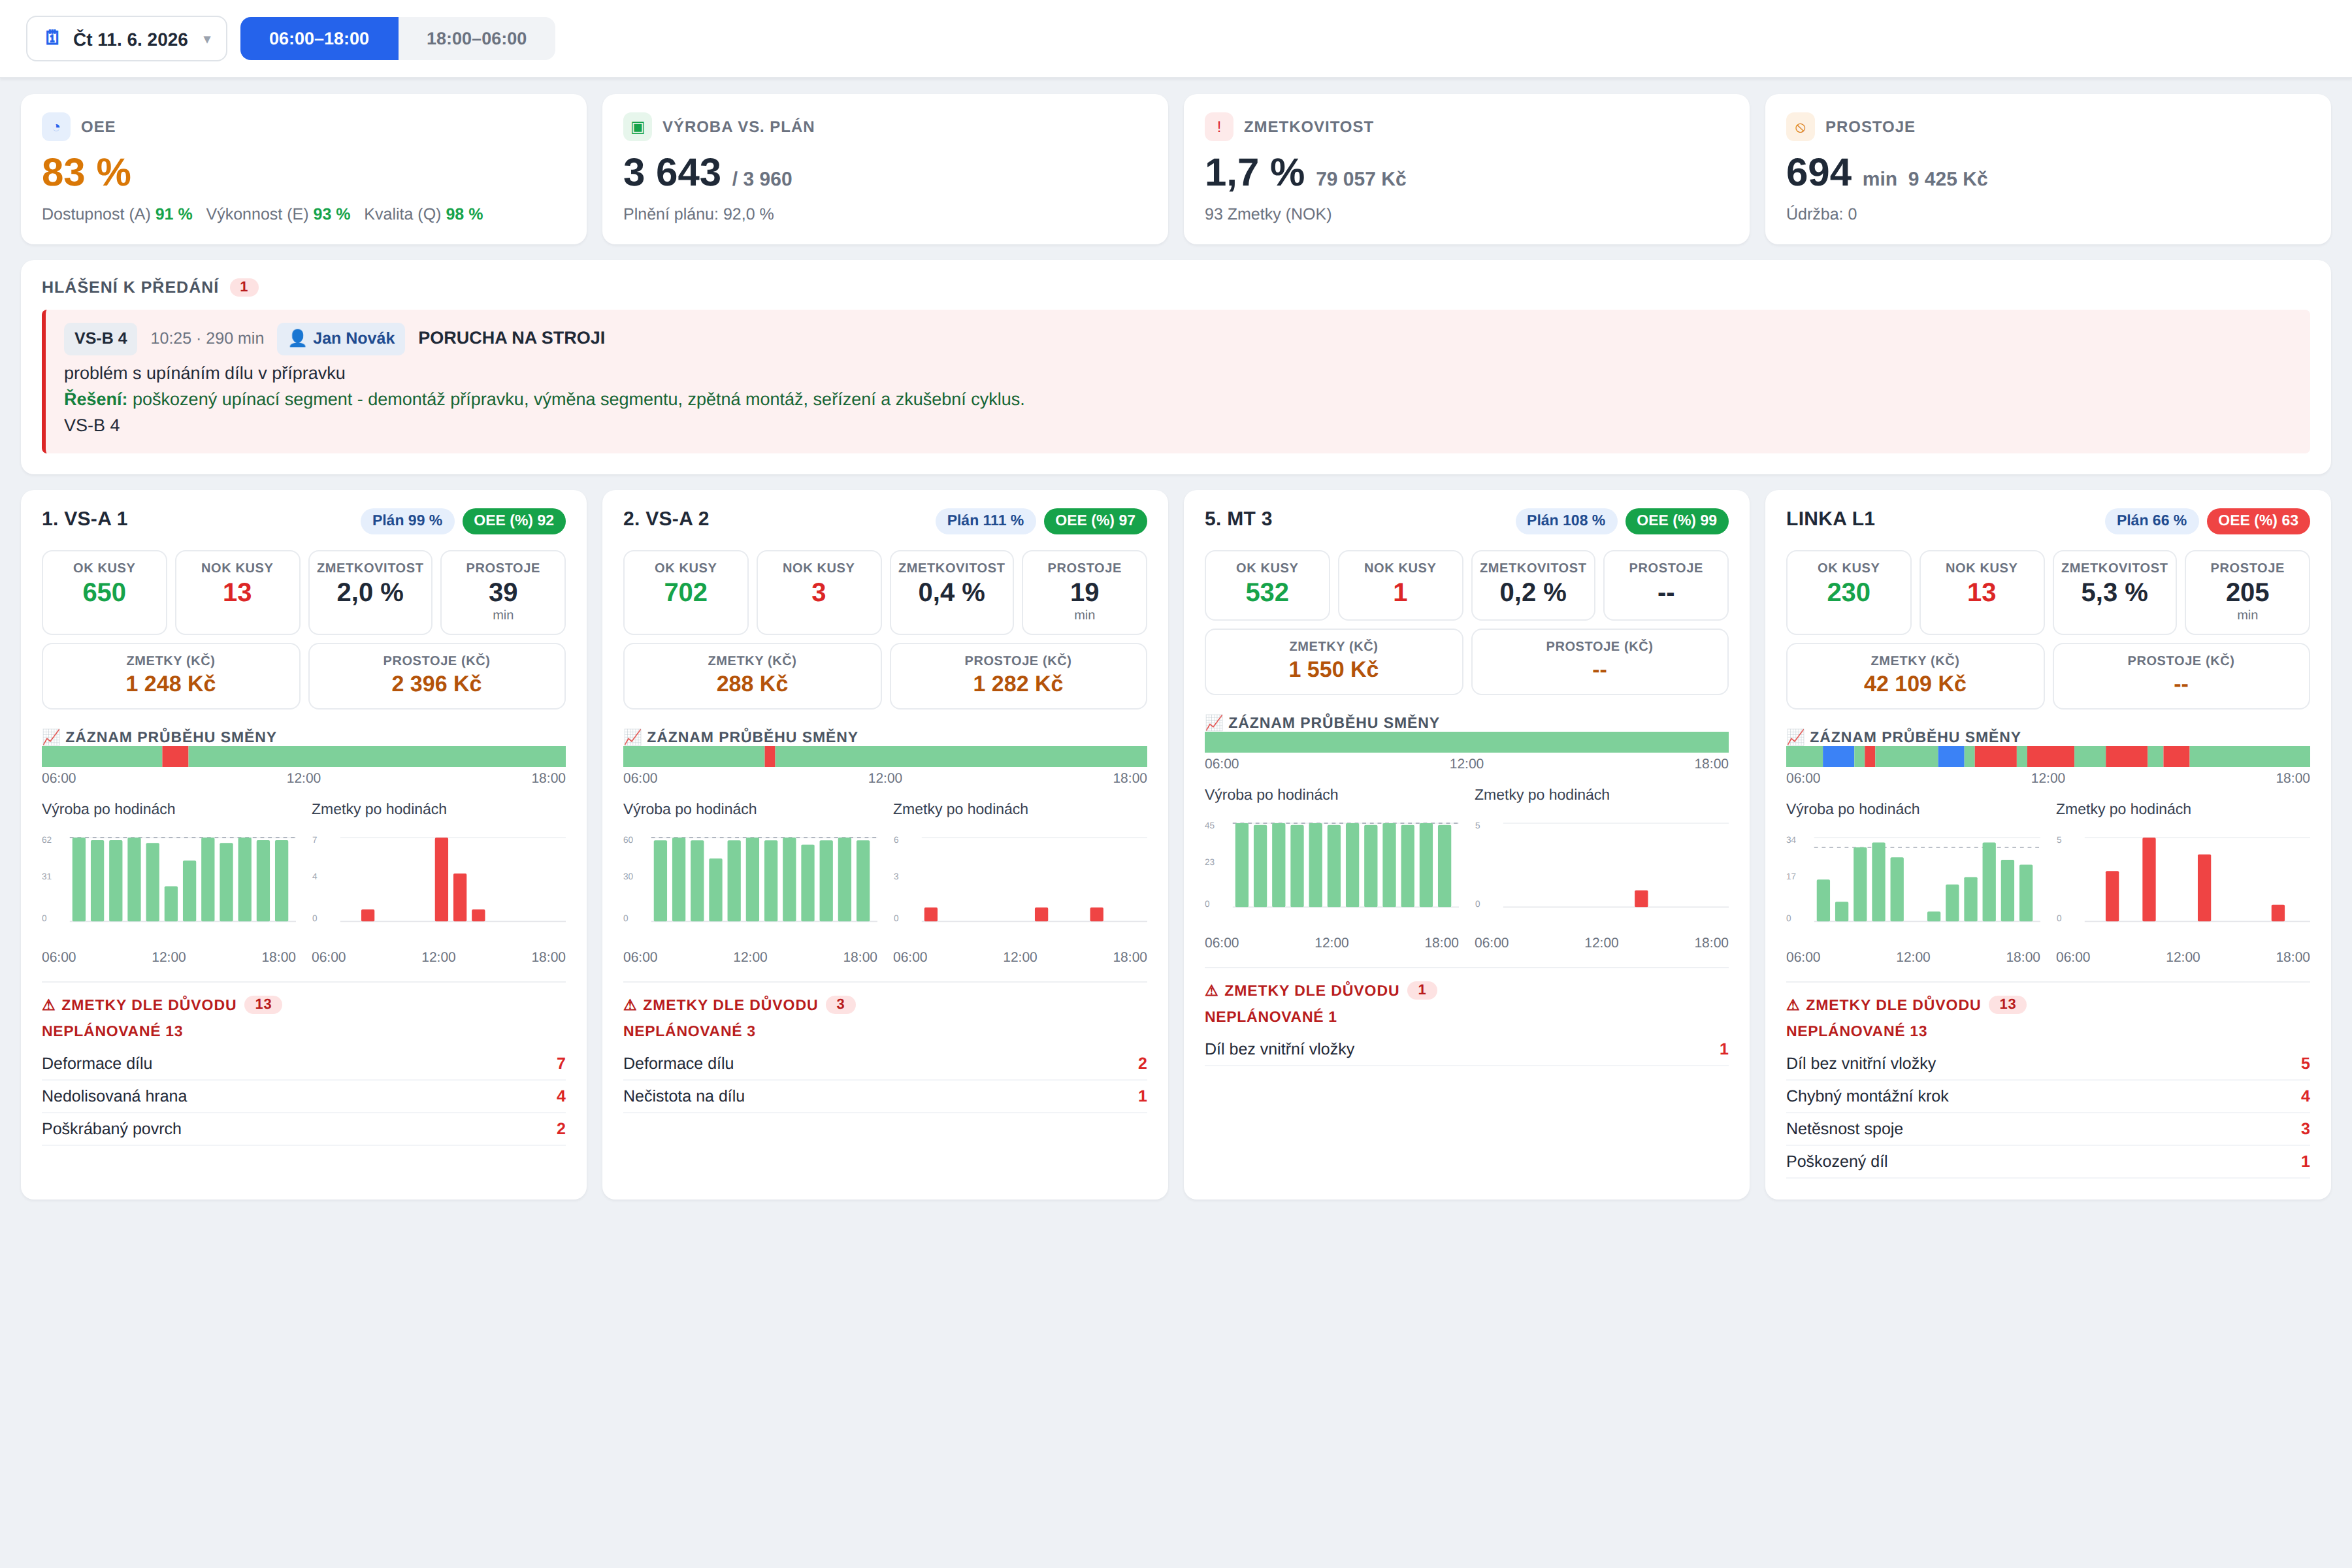
A closed shift is handed over on the Shift handover screen: OEE broken down into A/P/Q, plan attainment, scrap rate, downtime and any reports left open. The incoming supervisor knows exactly what they are walking into.
What's in it for the supervisor, and for management
A shift has a plan, staffing and accountability
The supervisor plans the shift type, team, station staffing and production plan; the system checks for clashes. In the morning it is clear who stands where and what is to be made.
You know reality by the hour, not by the month
The operator logs output continuously at the station. A shortfall shows up in the second hour of the shift, while you can still do something about it.
Scrap is logged where it happened
A few taps: station, product, reason, count. Quality then works with data from the point of origin, not an estimate pieced together at the end of the week.
Nobody calculates OEE by hand
Availability, performance and quality are built from output data and reported stoppages. The monthly spreadsheet drill and the arguments over whose number holds are gone.
The morning shift knows what the night left
Shift handover sums up KPIs, open reports, workplace maintenance and the hourly course. The incoming supervisor does not start by investigating what happened overnight.
A floor problem reaches the right team
A touch guide, based on the event type, offers to resolve it in-house or escalate. Responders get a notification and response time is measured.
After a repair, start-up is controlled
For downtime events you can enforce a release per IATF: a first-piece check or an escalation to quality. A customer complaint from a post-repair start-up has one less reason to happen.
Start-up checks always get done
Checklists tied to the workplace, shift type and station run within the shift record and flag checks with a finding. Provable for a customer audit.
Shift numbers become a management view
The same data feeds Analytics: OEE, plan attainment, scrap rate, cost and trends. Management and the floor stop bringing their own spreadsheets to the meeting.
The floor sees where it stands, right now
Live views count "today" from the start of the production day, not from midnight. And they never fake freshness: if data is older than 10 minutes, the Shift overview hides it rather than show it as live.
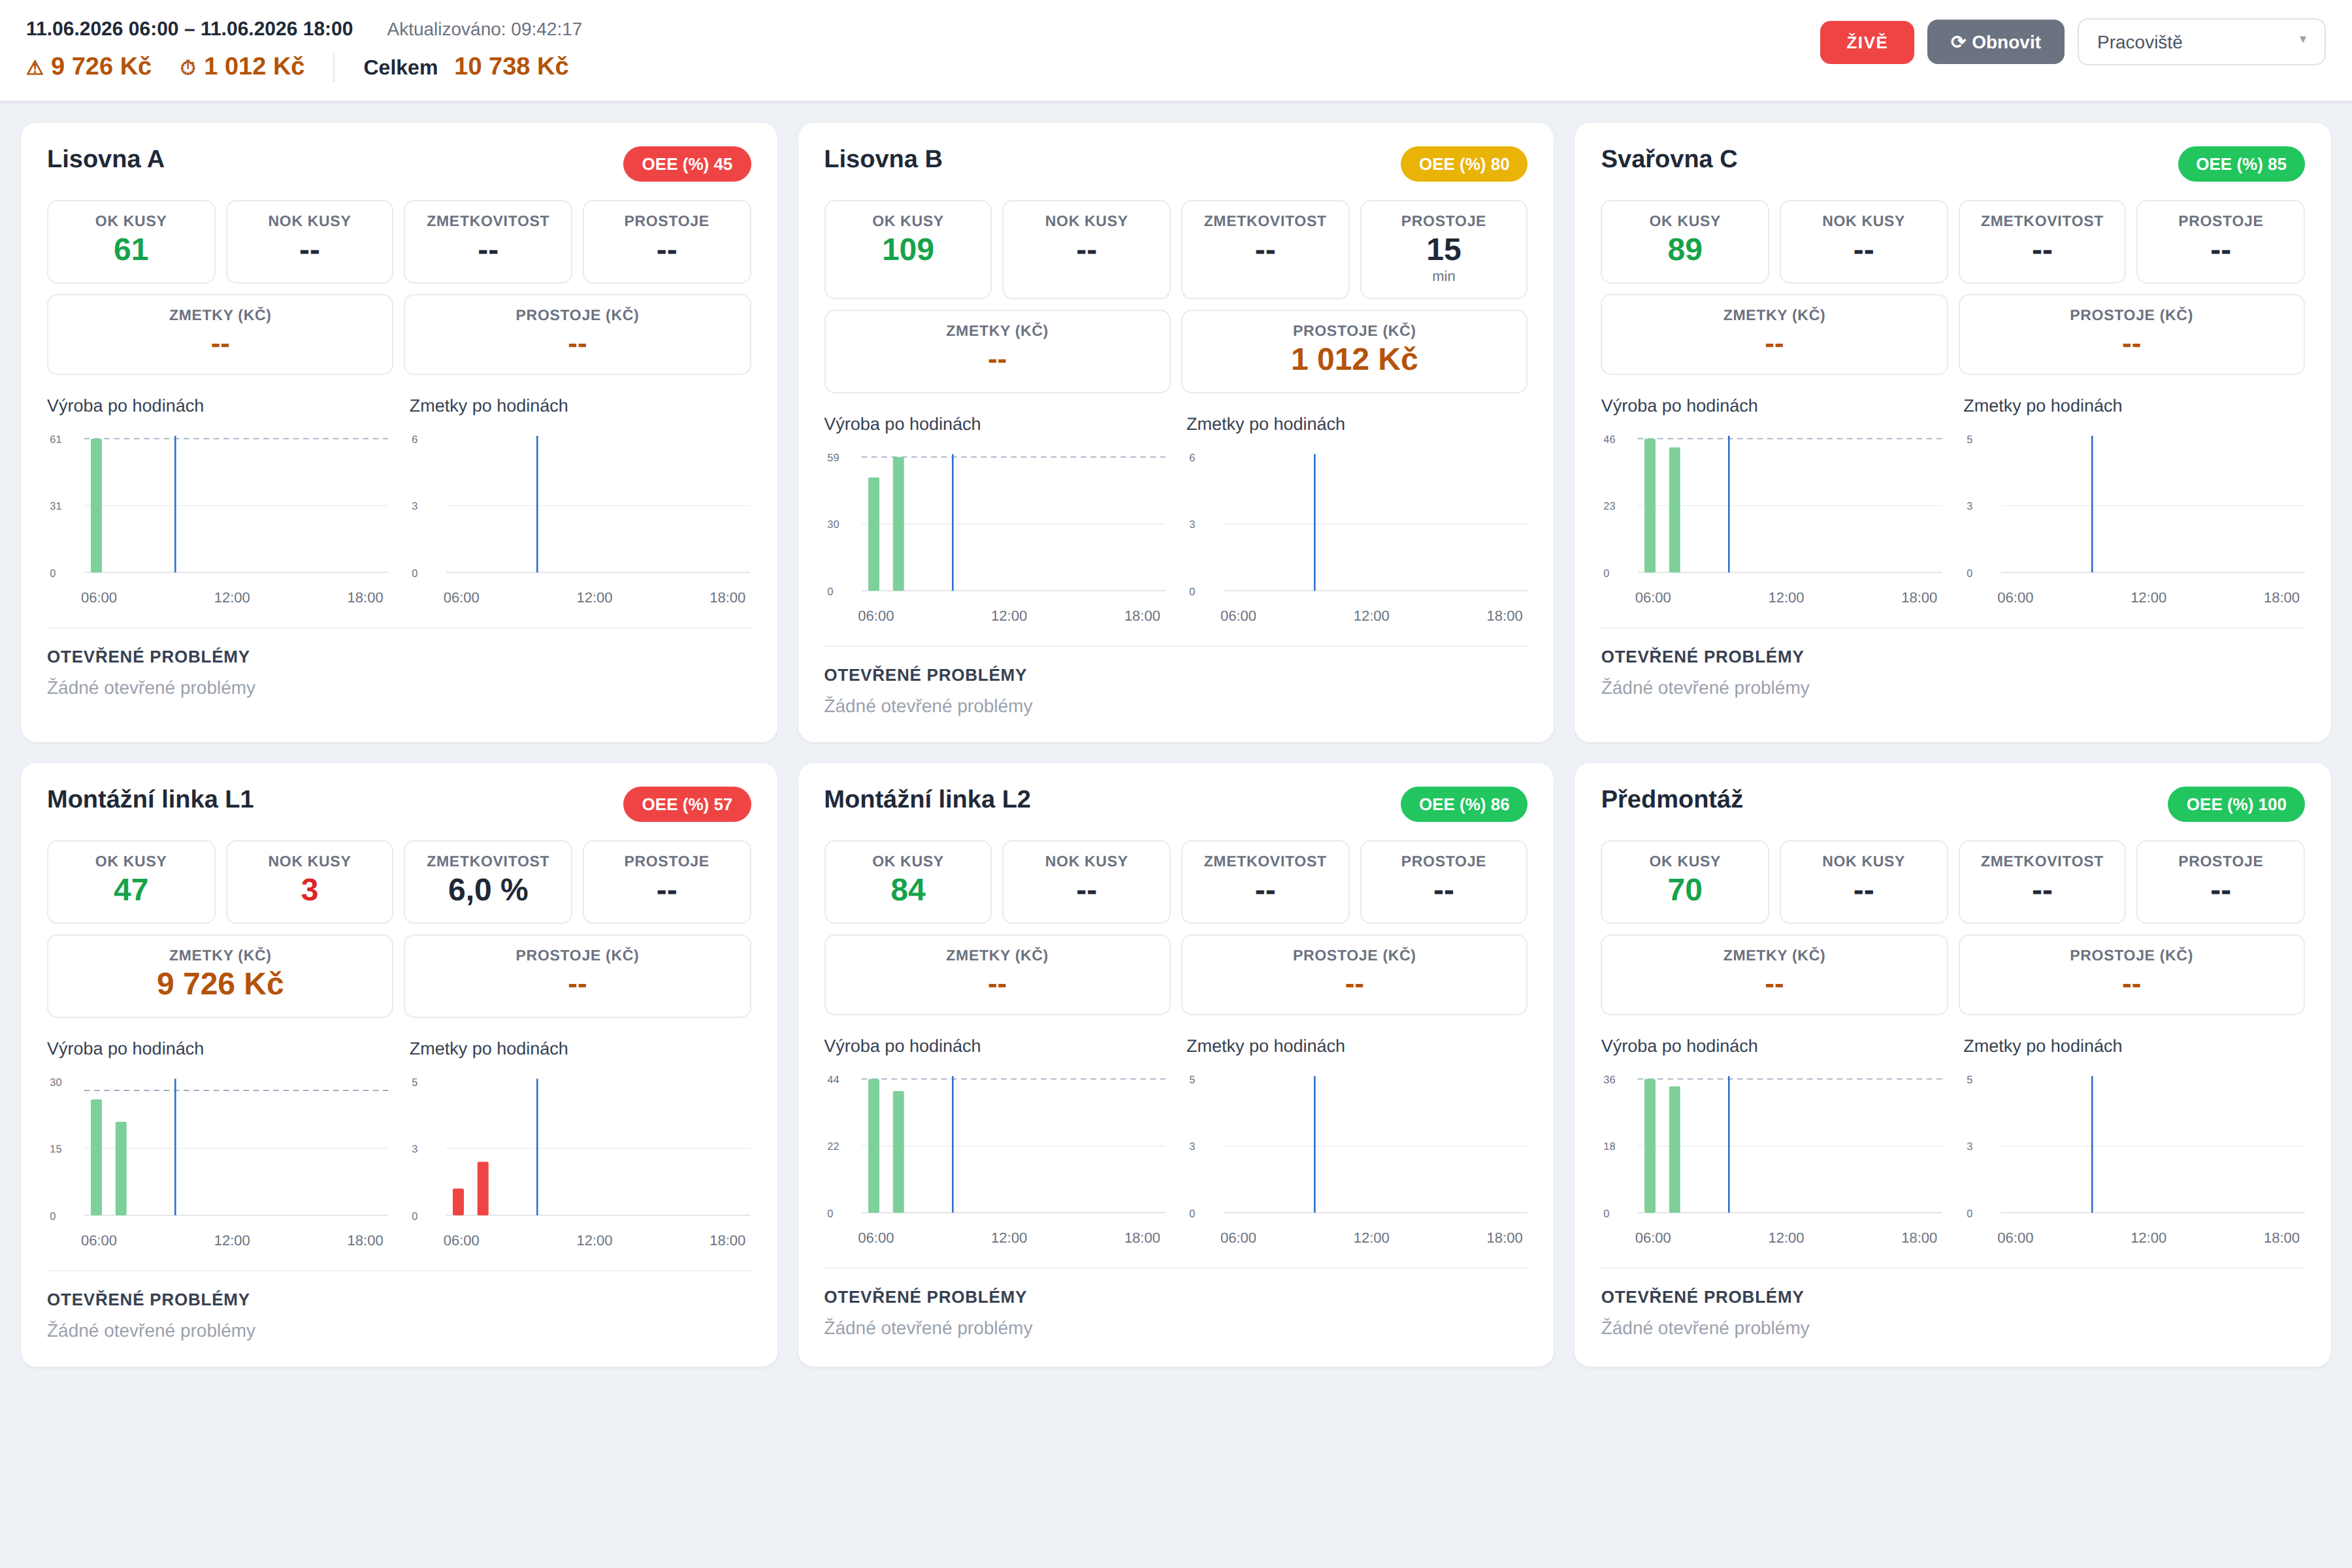
- Shift overview: a grid of cards per workplace with a running shift - an OEE chip, OK/NOK, scrap rate, downtime, hourly mini-charts and open problems. Refreshes every 60 seconds; workplaces in downtime rise to the top.
- Production timeline: a timeline per workplace - green for running, blue for planned and red for unplanned downtime. Day or week, with presets and filters by location and workplace.
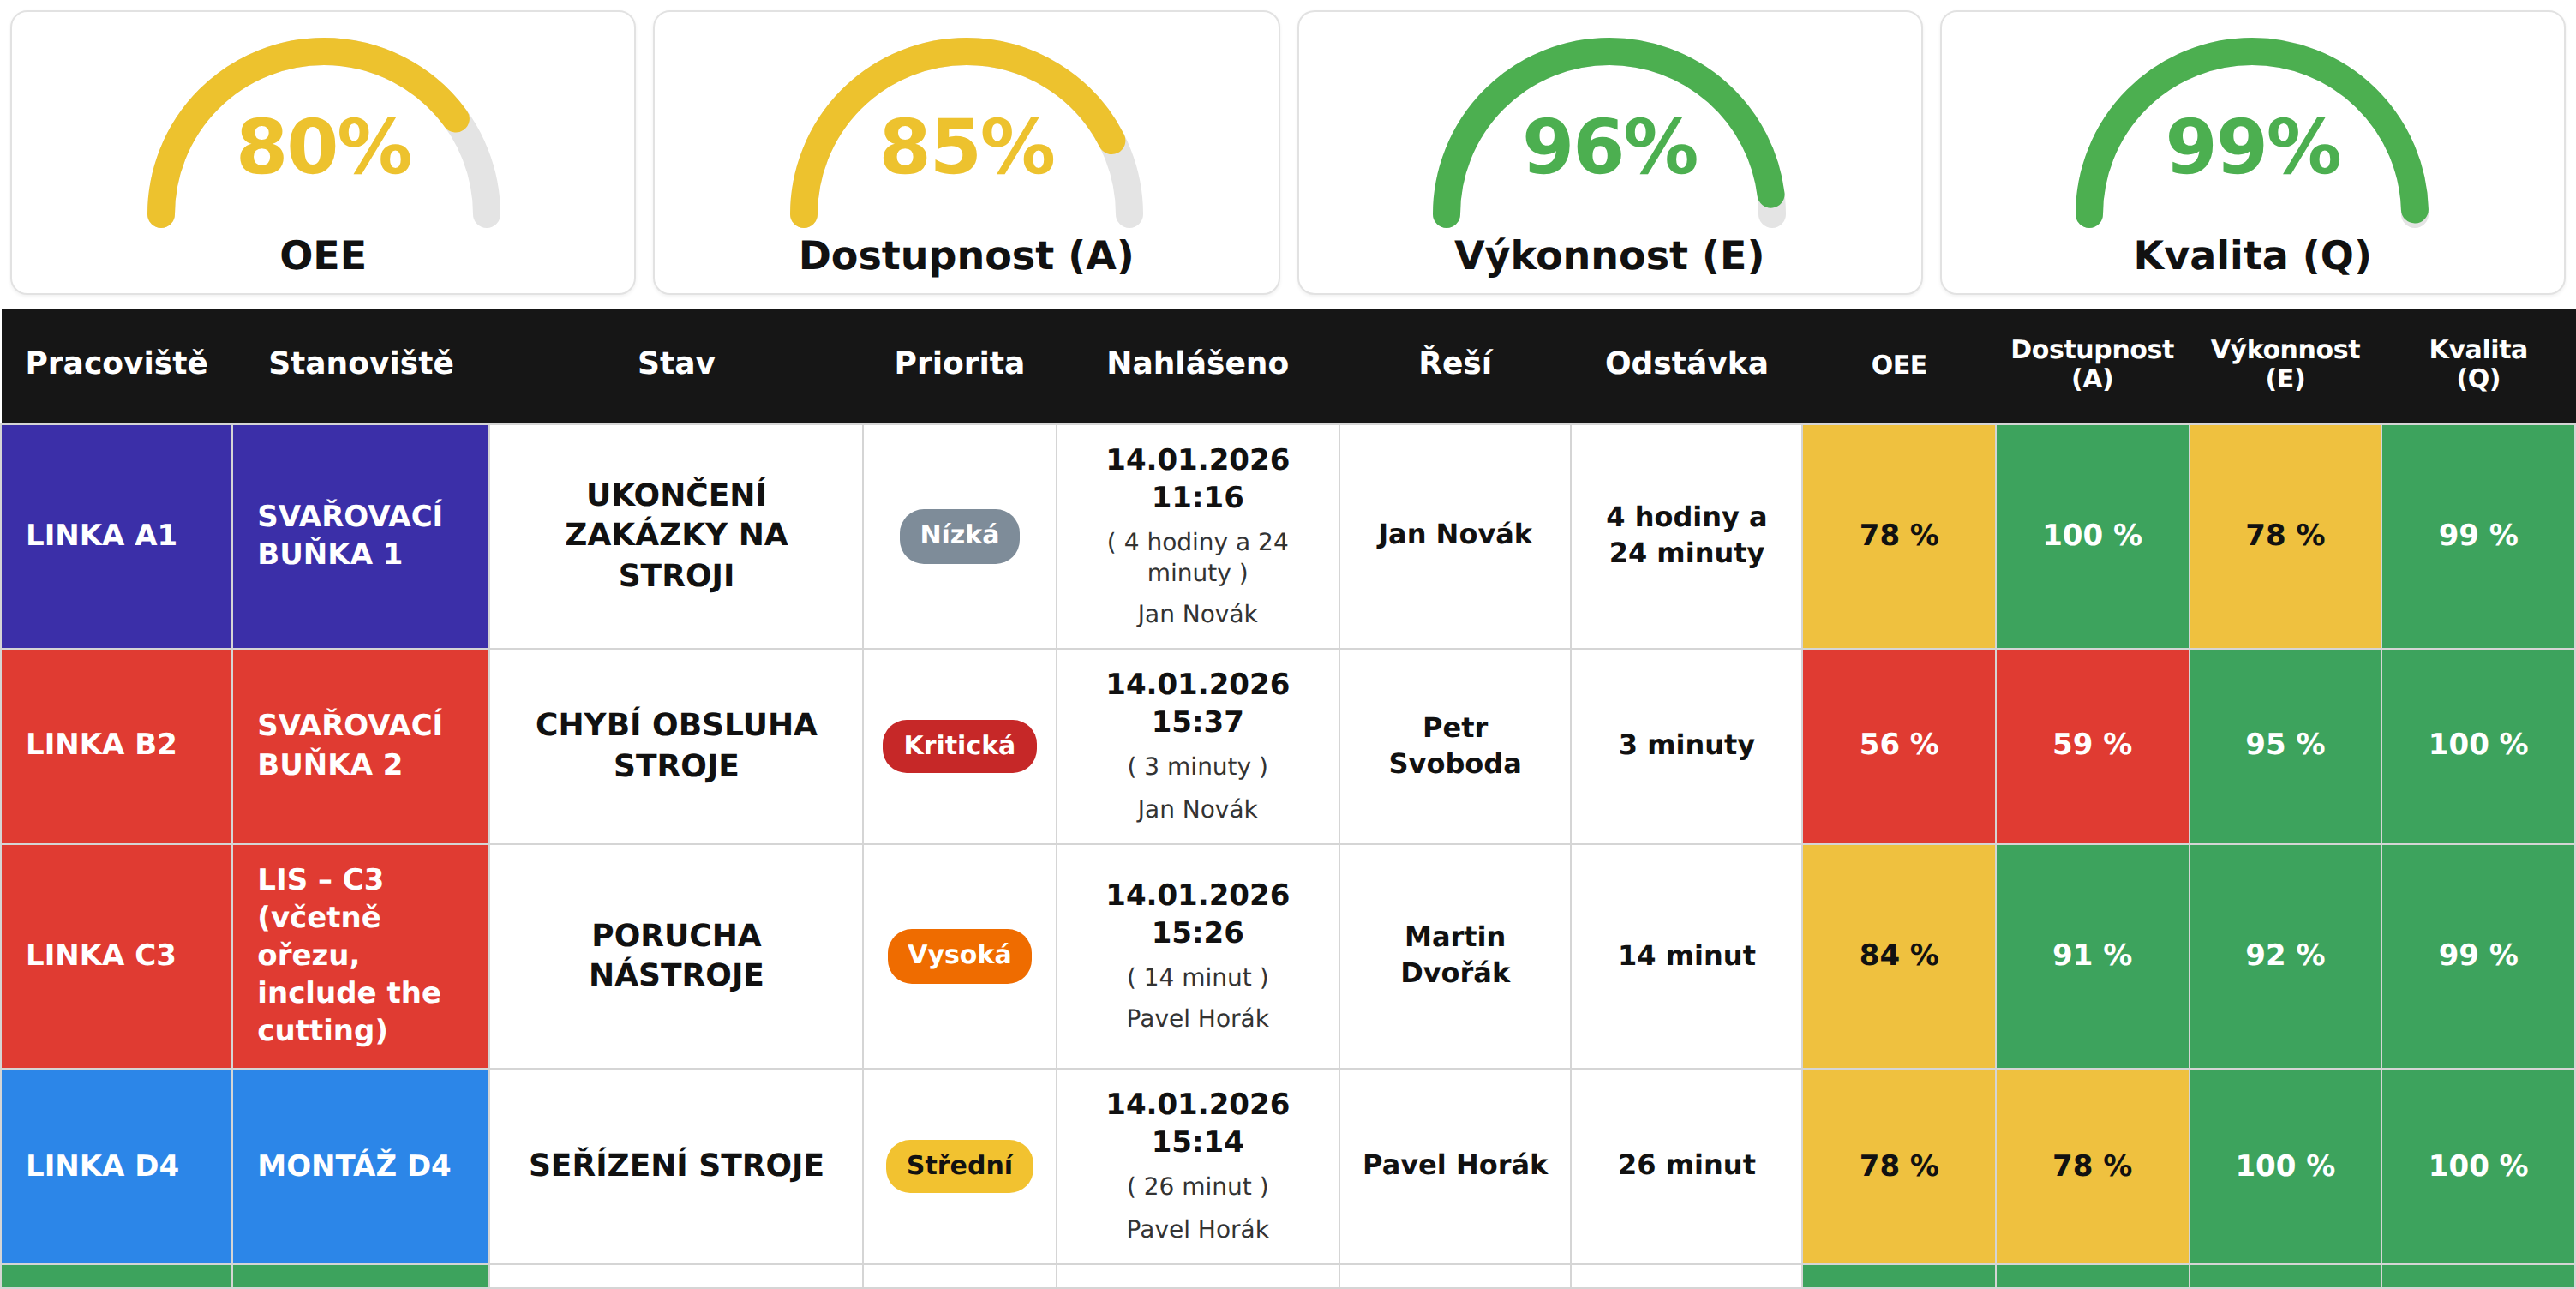
- LCD panels: large-format dashboards for screens on the floor, refreshing every 10 seconds. OEE gauge charts, a table of workplaces with current reports, selectable language and location, TV mode.
- Shift report: a daily grid of workplace × hours with a Plan / OK / NOK trio in each cell and downtime markers. Click a cell to open the shift detail; lists of shifts and station staffing with Excel export.
What each role gets out of it
Runs the shift and hands over the floor
- Plan, station staffing and clash checks in the shift calendar
- Shift handover with KPIs, open reports and maintenance
- You see plan shortfalls during the shift, not a month later
Watches scrap and production release
- Scrap with a reason and count from where it happened
- Controlled release after repair per IATF, with a first-piece check
- Start-up check checklists with provable completion
Finds where time is lost
- Downtime with type and duration as a basis for Pareto
- Recurring problems turned into an action plan
- A shift report by workplace and hour shows when performance drops
Tracks performance and cost
- OEE calculated from output data - one definition for the whole company
- Cost of downtime and scrap in currency with the financial permission variant
- Comparison of workplaces, shifts and plants over the same numbers
AI watches scrap. A human gives the verdict.
Scrap-rate anomaly detection
With company AI enabled, the Scrap page watches sudden spikes and creeping trends at the level of workplace, workplace × product and station × product, against the usual baseline for that workplace. Confirming or dismissing an incident requires a mandatory note, which also feeds back into future evaluation.
First-piece number from a photo
When releasing production after a repair, the first piece's serial number can be scanned from a QR code or read by AI from a photo. The number is never written automatically: the operator always confirms it against the part before it is saved.
Recurring problems
Floor reports flow into Problem analytics, where AI finds recurring problems on its own, breaks them down by Ishikawa cause categories and counts occurrences and downtime durations. From a report or the analytics you can open an action-plan project in one click.
AI features are turned on with a single company-wide switch. With AI off the module works fully, just without assistance.
Frequently asked questions
Production Management (TPM licence) covers shifts, hourly output, OEE, reporting and live data. Production (MES) - with production orders, dispatching and batch traceability - is a separate follow-on module with its own documentation and page.
No. OEE is never entered anywhere; it is calculated from output, scrap and downtime from reports. But direct accountability applies: a missing standard (Cycle Time) makes performance impossible to calculate, unlogged scrap overstates quality, and unreported downtime overstates availability. The analytics flag missing standards on their own.
If a fresh open report of the same type already exists on the workplace, the system flags the duplicate and lets the operator decide whether to continue. Reports are stamped with the shift when created, so they stay traceable afterwards.
Every report template has defined escalation teams, and each event type determines which of them are offered. On submit the operator chooses "I'll handle it" or "Escalate to a team"; the group expands to specific responders who get a notification, and response time is measured.
Yes, with the financial permission variant. Locations and workplaces carry hourly cost rates and scrap reasons can carry a price; the Shift overview and Shift handover then show Scrap (CZK) and Downtime (CZK), and Analytics computes scrap cost, lost profit and the total-cost trend.
The recommended minimum: turn on Shift management for the location, create shift types and stations, fill in product standards (Cycle Time), set up report templates with escalation teams, and assign roles. Without standards and correctly reported downtime, OEE will not add up.
We'll run one of your own shifts
Book a no-obligation online demo. We'll plan a shift, log an hour of output, report a breakdown with downtime, and you'll see how it instantly flows into OEE, shift handover and management dashboards.