What does the number 73.4% tell you?
You walk into a factory. You ask: "How are we doing?" You get the answer: "Pretty well," or "It could be better," or "We have problems with line three."
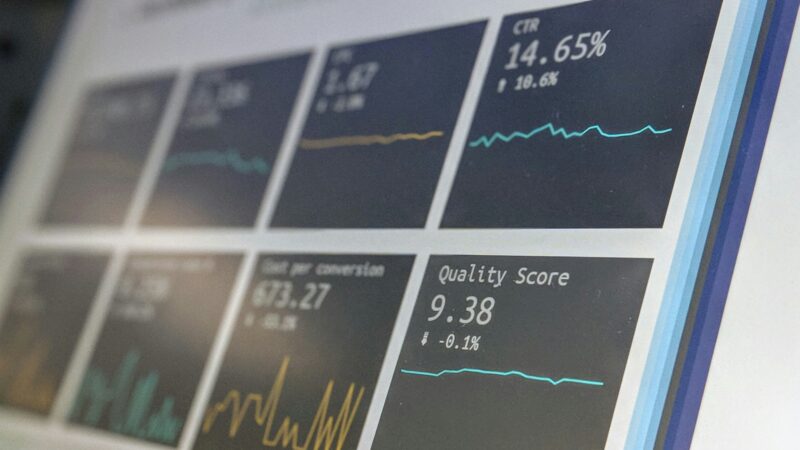
Now a different situation. You walk into a factory. On a large screen you see: OEE Line 1: 87.3% | Line 2: 79.1% | Line 3: 65.4%
Suddenly you know everything. Line 1 is a champion. Line 2 is solid. Line 3 has a problem. And you can start asking: Why?
That is the power of OEE – Overall Equipment Effectiveness.
Three numbers that tell you everything
OEE is not just one number. It is the product of three factors:
OEE = Availability × Performance × Quality
- Availability: How much of the time is the machine running vs. stopped?
- Performance: How fast is it producing vs. how fast should it be?
- Quality: How many parts are OK vs. how many are defects?
Each factor reveals a different type of problem:
- Low availability? You have downtime – breakdowns, changeovers, waiting for material
- Low performance? The machine isn't running at full speed – micro-stoppages, slow cycles
- Low quality? Something is misconfigured or worn out
A tale of two lines
Line A: OEE 75% (Availability 95% × Performance 85% × Quality 93%) Line B: OEE 75% (Availability 83% × Performance 95% × Quality 95%)
The same OEE. Completely different problems.
Line A: Runs almost constantly, but slowly and produces more defects. Solution? Recalibration, replacement of worn parts.
Line B: When it runs, it's fast and precise. But it stops too often. Solution? Better preventive maintenance, faster changeovers.
Without measurement, you would address both lines the same way. And you would be wrong.
When numbers come alive: Real-time visualisation
Martin is a shift supervisor. He has a 55" screen on the wall. On it he sees:
- OEE of all lines
- Current downtime
- Reported faults
- Trend over the last 7 days
It's 10:47. He sees that the OEE of line 5 has dropped from 82% to 78% over the last 30 minutes. Why? The cycle time is increasing. He goes to take a look. The operator says: "Something is slowing down the movement." Martin calls maintenance. They discover that the problem is caused by a contaminated pneumatic valve. Repair time: 5 minutes.
Production time saved: 2 hours.
If Martin hadn't had a live dashboard, he would have discovered the problem only when the machine failed completely.
5S audits: Why cleanliness matters
"We're not making chips. So why should we be so obsessed with cleanliness?"
Because:
- Cleanliness = Safety – No oil on the floor = no injuries
- Cleanliness = Visibility – When everything is messy, you can't see an oil leak
- Cleanliness = Culture – When the workplace is tidy, people respect it
- Cleanliness = Efficiency – When every tool has its place, you don't spend 10 minutes looking for it
5S (Seiri, Seiton, Seiso, Seiketsu, Shitsuke) is a Japanese methodology:
- Sort – Get rid of what's unnecessary
- Set in order – Everything has its place
- Shine – Regular cleaning is the standard
- Standardise – Create rules
- Sustain – Follow them
And digital audits ensure it doesn't only happen "when visitors come."
LPA: When management walks the floor
Layered Process Audits (LPA) – sounds daunting, but the principle is simple:
- Team leader audits daily for 5 minutes
- Manager audits weekly for 15 minutes
- Director audits monthly for 30 minutes
What do they audit? That standards are being followed. That checklists are completed. That the workplace looks according to 5S. That people know what to do.
And above all: That they ask "Why?" and listen to the answers.
The digital system tells them what to audit, where to go and what to check. It automatically records the results. It analyses trends.
Data analysis: When you notice the invisible
Petr is a production manager. Every Friday afternoon he spends 30 minutes analysing the week's data. He sees:
- OEE dropped on line 2 every Wednesday afternoon
- Why? Further analysis: Wednesday = parts change from supplier X
- Even deeper: Parts from supplier X have a higher non-conformance rate
- Action: Resolve with the supplier / change supplier
Monthly saving: 35,000 CZK. Time spent on analysis: 30 minutes.
Without a digital system, he would never have seen these differences. The losses would have continued indefinitely.
Measurable growth: OEE from 65% to 89% in three years
An engineering company in Ostrava. Start of 2021: Average OEE 65%. "Normal for our industry," they said.
What they did:
- Year 1 (2021): Introduced OEE measurement and visualisation, identified the main sources of downtime, started with digital fault reporting and autonomous maintenance
- Year 2 (2022): Implemented preventive maintenance, 5S audits and systematic data analysis, expanded the solution to all lines
- Year 3 (2023): Introduced predictive maintenance with AI, optimised processes, established a Kaizen culture
Result end of 2021: Average OEE 72%. Increase: 11% Result end of 2022: Average OEE 81%. Increase: 25% Result end of 2023: Average OEE 89%. Increase: 37%
Did they change machines? No. Did they hire new people? No. Did they change their approach and start measuring? Yes.
Kaizen: The endless spiral
The Japanese word Kaizen means "change for the better". But in manufacturing it has a special meaning: Small, continuous improvement.
Not a revolution. Not a transformation. Just a little better every week.
And the digital system makes it possible:
- Weekly meeting: Look at the data
- Identify: Where did we lose the most time/money this week?
- Brainstorm: How can we solve it?
- Action: A small change, try it out
- Measurement: Did it help?
One year = 52 small improvements. Most will fail. But 20 will succeed. And after a year you're somewhere completely different.
How long does it take?
The typical question: "When will we see results?"
The reality:
- First steps (reporting, checklists): 2–6 weeks
- Preventive maintenance: 2–4 months
- OEE analyses: 3–6 months
- Predictive maintenance: 6–12 months
- Cultural change: 12–24 months
But: Even after a year you're not at the end. Because Kaizen never ends.
Final numbers
When you combine all 7 steps systematically:
- Fault reporting: 3–7%
- Autonomous maintenance: 10–15%
- Preventive maintenance: 10–15%
- 5S and LPA: 3–8%
- OEE and analyses: 10–20%
- Predictive maintenance: 10–15%
- Kaizen: >30% in the long term
Total potential: 30–50% increase in productivity
Not in a month. But in one to two years? Realistically.
Conclusion: A journey, not a destination
Digital TPM is not a project. It is a journey. It begins with the first step – replacing a paper notebook with digital reporting. And it never ends, because there is always room for improvement.
Companies that embarked on this journey five years ago are today the leaders of their industries. Those that start today will be the leaders of tomorrow. And those that are waiting?
They are waiting until it's too late.